
Chesapeake Bay Hypoxia Report – May 2024
Lower oxygen conditions this spring consistent with yearly forecast model
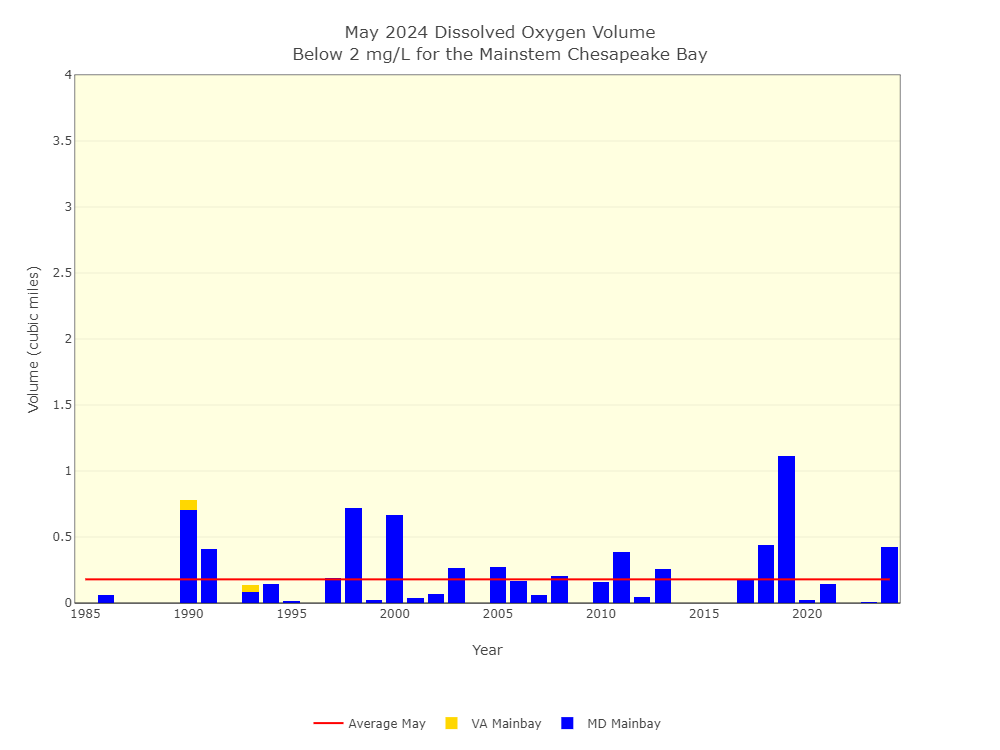
Graph of comparative dissolved oxygen levels in the Chesapeake Bay
Data collected by the Maryland Department of Natural Resources and Old Dominion University show that May 2024 dissolved oxygen conditions in the Chesapeake Bay mainstem of Maryland and Virginia were worse than average. The results are from samples collected during regular monitoring cruises conducted aboard research vessels.
The hypoxic water volume — waters with less than 2 mg/l oxygen — was 0.42 cubic miles during the 2024 mid-May monitoring cruise, compared to the May average (1985-2023) of 0.18 cubic miles. This May ranks as the sixth largest volume of hypoxic water on record for the respective time period. No anoxia – areas of water with less than 0.2 mg/l oxygen – was observed in the May 2024 monitoring cruise.
 Maryland and Virginia combined mainstem Bay monitoring results provide a comparison to the yearly seasonal forecast by the U.S. Environmental Protection Agency’s Chesapeake Bay Program, U.S. Geological Survey, University of Maryland Center for Environmental Science, and University of Michigan.
In late June, this forecast expected Chesapeake Bay mainstem hypoxic volume to be 4% higher than the 39-year average, due to increased river flows and resultant higher nitrogen loads from January through May 2024.
Crabs, fish, oysters, and other creatures in the Chesapeake Bay require oxygen to survive. Scientists and natural resource managers study the volume and duration of Bay hypoxia to determine possible impacts to bay life.
Ongoing efforts to reduce nitrogen and phosphorus pollution from industrial and wastewater sources, agricultural land, and cities and towns are aimed at reducing hypoxic conditions in the Bay. In the water, nitrogen and phosphorus fuel algal blooms that remove oxygen from the water when they die off and decompose.
 Each year from May through October, the Department of Natural Resources computes hypoxia volumes from the water quality data managed by department staff and the Virginia Department of Environmental Quality. Data collection is funded by these states and the Chesapeake Bay Program. Bay hypoxia monitoring and reporting will continue through the summer. Additional Maryland water quality data and information, including the Department of Natural Resources hypoxic volume calculation methods, can be found on the Eyes on the Bay website.