
Tools of the Trade: Water Quality Sondes
 Department of Natural Resources scientists monitor Maryland’s waters to determine the habitat health for fish, crabs, oysters, and other aquatic organisms. Results from our monitoring programs measure the current status of waterways, tell us whether they are improving or degrading, and help to assess and guide resource management and restoration actions. Information is collected on nutrient (nitrogen and phosphorus) and sediment concentrations, algal blooms, and physical, biological, and chemical properties of the water. While many water samples are taken and analyzed later at a laboratory, modern instruments called water quality sondes allow for the immediate collection of some parameters.
A sonde is essentially a computer and a power supply that can be submerged, and have a wide variety of sensors attached to it to measure different parameters:
- Temperature/Conductivity – Water temperature can influence a variety of functions for aquatic animals such as distribution, migration, metabolism, survival, predation, and reproduction. A conductivity sensor assesses the ability of water to conduct an electrical current, which is directly related to the concentration of dissolved ions that are present. Its measurements can be translated to salinity, a parameter that has many of the same influences as temperature.
- pH – The pH sensor uses an electrode to measure the concentration of hydrogen ions in the water. This value, along with temperature, is used to calculate pH, a measure of acidity or alkalinity. Water that is too acidic (low pH) can have many impacts, such as improper shell formation in oysters and clams, and complex effects on finfish physiology, growth, survival, and behavior. Acidification of waters can be caused by organic matter decomposition, inputs from land, carbon absorbed from the atmosphere, and low dissolved oxygen. High pH may indicate an algae bloom, as algae consume carbon dioxide from the water.
- Dissolved Oxygen (DO)- Oxygen is as essential in the water as it is in the atmosphere. Concentrations and durations of oxygen needed can vary widely among organisms. A complex optical sensor measures DO concentrations in milligrams per liter (mg/l). DO of 2 mg/l or less is called hypoxia and is the point where most organisms will experience extreme impacts. Low dissolved oxygen is most often observed in deeper bottom waters and is the result of the bacterial decay of dying algal blooms produced by excessive nutrients. Low dissolved oxygen can also be observed in shallow waters at night and early morning while algae are respiring and consuming oxygen.
- Turbidity –An optical sensor emits LED light through the water and a photodetector measures the intensity of light scattered or absorbed by the suspended particles in the water. These particles can be sediment, organic matter, or algae. Higher turbidity means cloudier water and less light for underwater grasses to grow and provide essential aquatic habitat.
- Chlorophyll – Chlorophyll is a pigment vital for photosynthesis in algae. An optical sensor, calibrated to measure specific wavelengths, measures the concentration of chlorophyll and gives an approximation of algal concentrations. Algae are essential food for many organisms, but in excess they can limit light in the water and create low dissolved oxygen during their decay.
Sondes can be deployed from a research vessel or small boat to see how parameters change in the water column from top to bottom.
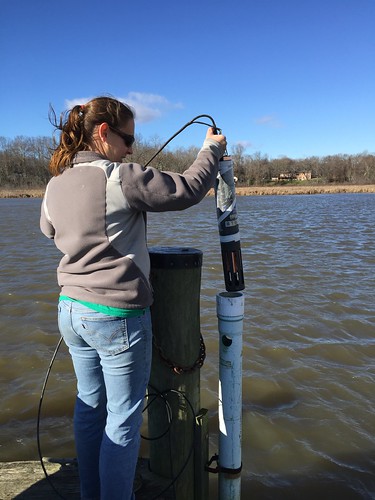
For DNR’s continuous monitoring projects, sondes collect data every 15 minutes. They are deployed off of piers and pilings in shallow waters, buoys in deeper water, and on a pontoon-based vertical profiler that raises and lowers the instrument in the water column. Results can be sent via cell phone telemetry and displayed in real-time on the web.
Sondes can even be deployed on a small boat using a system called DATAFLOW. As the boat travels a waterway, a pump draws water across the sensors and readings are taken every four seconds. Those spatially intensive measurements are used to create maps of surface water quality.
Learn more about DNR’s monitoring and explore the data at Eyes on the Bay: eyesonthebay.dnr.maryland.gov.
Mark Trice is DNR’s Water Quality Informatics Program Chief for the Resource Assessment Service.
Article appears in Vol. 26, No. 3 of the Maryland Natural Resource magazine.