
June 2022 Chesapeake Bay Hypoxia Report
Chesapeake Bay Dissolved Oxygen Conditions Better than Average
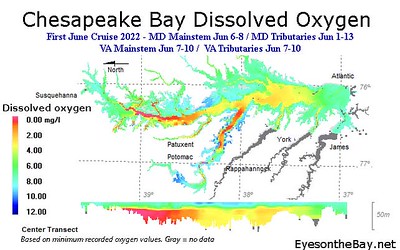
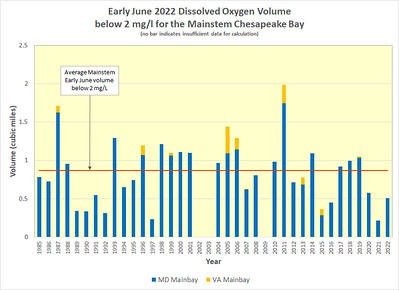
 Data collected by the Maryland Department of Natural Resources (DNR) and Old Dominion University show that dissolved oxygen conditions in the Chesapeake Bay mainstem of Maryland and Virginia were better than average in June 2022. The hypoxic water volume — waters with less than 2 mg/l oxygen — was 0.51 and 0.98 cubic miles during early and late June monitoring cruises, compared to historical early and late June averages (1985-2021) of 0.87 and 1.31 cubic miles.
During their respective time periods, the early June volume ranks as the 8th best on record and late June was 12th best. Additionally, a small volume of less than 0.1 cubic miles of anoxia – waters with less than 0.2 mg/l oxygen – was observed during the late June cruise. Hypoxia was essentially zero (0.0002 cubic miles) in May.

 Maryland and Virginia combined results are presented for the mainstem Bay to be more comparable to the yearly seasonal forecast by the U.S. Environmental Protection Agency’s Chesapeake Bay Program, U.S. Geological Survey, University of Maryland Center for Environmental Science, and University of Michigan.
In late June, the forecast expected mainstem hypoxic volume to be 13% lower than the 37-year average, due to reduced river flows from January through May 2022, as well as less nitrogen carried to the Bay because of nutrient management efforts. Maryland and Virginia’s monitoring results thus far have matched the forecast of better-than-average conditions.
Crabs, fish, oysters, and other creatures in the Chesapeake Bay require oxygen to survive. Scientists and natural resource managers study the volume and duration of Bay hypoxia to determine possible impacts to aquatic life.
Each year from May through October, DNR computes hypoxia volumes from the water quality data collected by DNR and Virginia Department of Environmental Quality.
Data collection is funded by these states and the Chesapeake Bay Program. Bay hypoxia monitoring and reporting will continue through the summer. Additional Maryland water quality data and information, including DNR’s hypoxic volume calculation methods, can be found at DNR’s Eyes on the Bay website.