
Chesapeake Bay Hypoxia Report – Year-End 2021
Divided Season Results in Near Average 2021 Hypoxia
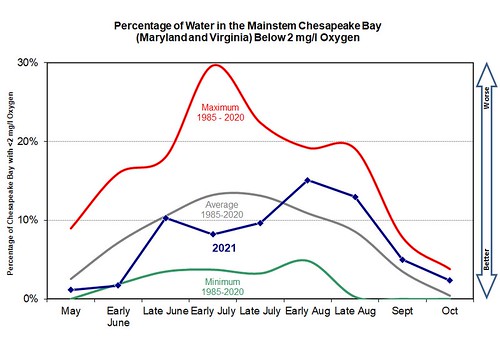 Monitoring of dissolved oxygen conditions in the Chesapeake Bay mainstem of Maryland and Virginia showed a tale of two different halves for the 2021 season. The Bay experienced below average hypoxia — areas with less than 2 mg/l of dissolved oxygen — from May through July, followed by above average hypoxic volumes August through October. When averaged over the full 2021 season, hypoxic volume was slightly below the historical seasonal average, consistent with forecasts made in the spring.
 The Maryland Department of Natural Resources (DNR) and Old Dominion University collect Chesapeake Bay dissolved oxygen measurements year-round, monthly from September to May and twice monthly from June through August. These data show the period May through July 2021 experienced below average hypoxia due to less than average flows of water and nitrogen into the Chesapeake from January to May 2021. Early and late August cruises observed an increase in hypoxic volumes above the historical average for their respective time periods, largely due to weather conditions.
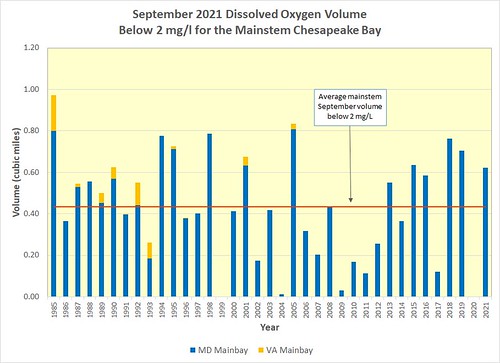 The hypoxic water volume was measured as 0.62 and 0.29 cubic miles during the September and October monitoring cruises, compared to historical averages (1985-2020) of 0.43 and 0.05 cubic miles. Chesapeake Bay hypoxia has been observed during October in 40% of the years since 1985, and 2021 was the third highest October hypoxic volume during that period. Additionally, average seasonal anoxia — zones with less than 0.2 mg/l oxygen — were the highest seen since 2011.
According to the National Oceanic and Atmospheric Administration’s National Centers for Environmental Information, average temperatures 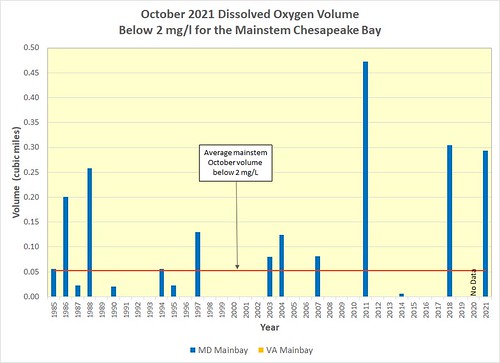 in August and September were the fifth-warmest for those months on record in Maryland, with lower-than-average wind speeds and greater-than-average precipitation seen in the Chesapeake Bay watershed, especially Pennsylvania. The Susquehanna River flows from July through September 2021 were the fourth highest on record as a result. These factors likely contributed to worsening hypoxia in the latter half of the season, as warmer waters hold less oxygen, less wind results in decreased mixing of oxygen into deeper waters, and higher freshwater flows into the Bay reinforced the stratification of the water column. This stratification, where less dense freshwater sits on top of denser saltier bottom waters, also inhibits mixing of oxygen into deeper water.
 DNR monitors the Chesapeake Bay and its tributaries year-round to assess habitat conditions, including dissolved oxygen, for crabs, fish, oysters and other aquatic life, as well as nutrient and sediment inputs that affect those conditions. Scientists and natural resource managers study the volume and duration of Bay hypoxia and other water quality parameters to determine possible impacts to Bay life and improve the Chesapeake Bay’s health.
Each year from spring to fall, DNR reports hypoxic volumes in the Bay using data from the State of Maryland and Virginia’s Department of Environmental Quality monitoring programs. Data collection is funded by these states and the U.S. Environmental Protection Agency’s Chesapeake Bay Program.
Beginning this year, combined results for Maryland and Virginia are being presented for the mainstem Bay, to be more comparable to the yearly seasonal forecast by the Chesapeake Bay Program, U.S. Geological Survey, University of Maryland Center for Environmental Science, and University of Michigan. The most recent forecast, released in late June 2021, expected Chesapeake Bay mainstem hypoxic volume to be 14% lower than the 35-year average due to reduced river flows from January through May 2021, as well as less nitrogen carried to the Bay because of nutrient management efforts.
Bay hypoxia reporting will resume in May or June 2022 as conditions warrant. Additional Maryland year-round water quality data and information, including DNR’s hypoxic volume calculation methods, can be found at DNR’s Eyes on the Bay website.