
June 2020 Hypoxia Report
 Maryland Department of Natural Resources monitoring data show that dissolved oxygen conditions in the Maryland portion of the Chesapeake Bay mainstem continued to be better than average in June 2020. The hypoxic water volume — waters with less than 2 mg/l oxygen — was 0.56 and 0.90 cubic miles, respectively, during early and late June monitoring cruises, compared to historical (1985-2019) early and late June averages of 0.93 and 1.13 cubic miles, respectively. Both hypoxic volumes rank within the top third of best results observed in the historical record within their respective time frames.
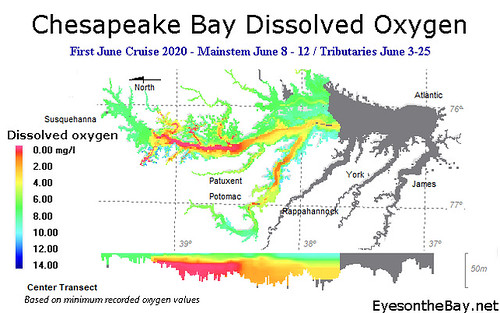 Mainstem data were not collected in Virginia during early June, but Virginia’s late June bay monitoring observed no hypoxia. No anoxic zones — areas with less than 0.2 mg/l oxygen — were observed in the Maryland or Virginia bay mainstem. Better-than-expected dissolved oxygen conditions can be partly attributed to lower than average precipitation in May and June, and a cooler than average May. Maryland’s water quality data can be further explored with a variety of online tools at the Department’s Eyes on the Bay website.
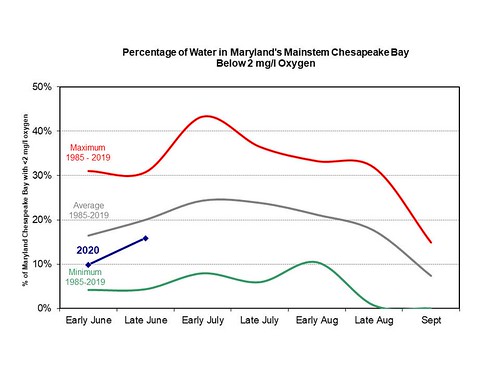 In mid-June, the Chesapeake Bay Program, U.S Geological Survey, University of Maryland Center for Environmental Science, and University of Michigan scientists released their prediction for slightly smaller-than-average 2020 hypoxic conditions based on slightly less-than-average water and nitrogen flows into the bay from January to May 2020. Monitoring results thus far have matched that forecast.
Crabs, fish, oysters, and other creatures in the Chesapeake Bay require oxygen to survive. Scientists and natural resource managers study the volume and duration of bay hypoxia to determine possible impacts to bay life. Each year from June through September the Maryland Department of Natural Resources computes these volumes from data collected by Maryland and Virginia monitoring teams during twice-monthly monitoring cruises. Data collection is funded by these states and the Environmental Protection Agency’s Chesapeake Bay Program. Bay hypoxia monitoring and reporting will continue through the summer.