Summer 2017 Hypoxia Report
Maryland’s Water Quality Monitoring Data Indicates Second Best Year on Record
Dissolved oxygen conditions in Maryland’s Chesapeake Bay mainstem were much better than average this summer, according to Maryland Department of Natural Resources.
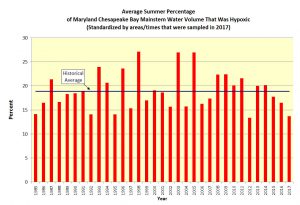
The results show that 2017 had the second-smallest Chesapeake Bay hypoxic volume (dissolved oxygen concentrations below two milligrams per liter) since 1985, for the regions and times where water quality monitoring data could be collected. This summer had an average of 13.6 percent of sampled waters with hypoxia. The best year on record was 2012 with 13.3 percent. The average for 1985-2017 is 18.9 percent.
For September 2017, the Chesapeake Bay hypoxic water volume was 0.06 cubic miles, which is much smaller than the September 1985-2016 average of 0.35 cubic miles.
Each summer since 1985, Maryland and Virginia have monitored the Chesapeake Bay and its tributaries for an array of water quality parameters that indicate habitat conditions for crabs, fish, oysters and other aquatic organisms. Dissolved oxygen in the water is one of those important habitat conditions, as most aquatic life requires it for survival.
From twice monthly cruises in June, July and August, and a single cruise in September, the Maryland Department of Natural Resources estimates the volume of hypoxia in its portion of the Chesapeake Bay and compares current conditions and data with historic results. Twice monthly hypoxia reports from June through August are available here.
Monitoring the Chesapeake Bay presented many challenges in 2017. Wind and rough seas prevented a complete sampling of waters during some cruises. In late July, weather precluded the sampling of stations on the east and west side of the bay channel. Without those station results, an exact calculation of hypoxic volume was not possible. Analysis of main channel dissolved oxygen indicated that hypoxic volume in deeper waters was average to above average for late July. In late August, the southernmost bay station in Maryland was not sampled. Analysis for late August was therefore only computed on 75 percent of the volume of Maryland’s bay, from the mouth of the Susquehanna River to just north of the Potomac River. Results were then compared to prior year’s results from that same region.
Due to the incomplete data record, an average summer hypoxic volume could not be computed that would be comparable to previous years. Therefore, a standardized measure of the average percentage of hypoxia observed in waters sampled was used. Cruises from early June, late June, early July, early August and September were completed, and hypoxia volumes were divided by total Maryland mainstem bay volume. Truncated late August hypoxic volumes were calculated and divided by the 75 percent of bay volume that was sampled. Percentages of hypoxic water from those cruises were then averaged. Late July data were excluded. A similar methodology was followed for previous years’ calculations for comparability.
Hypoxia is driven by natural forces such as stratification of water by salinity and temperature gradients that prevents oxygen from reaching or mixing into deeper waters, and by warmer waters, which naturally hold less oxygen. Hypoxia is also made worse by the addition of nutrients, such as nitrogen and phosphorus. Nutrients fuel algal blooms that then die-off and consume oxygen during decomposition.
Resource management actions and volume of water flow can determine how much of those nutrients enter the bay. Conditions could be more favorable, due in part to the overall influence of Chesapeake Bay restoration efforts to reduce pollution. The U.S. Geological Survey shows that water flow into the bay has been average or below average since 2012, with 2011 being the last year with above average flows due to Hurricane Irene and Tropical Storm Lee. This six year term of average to reduced flows also contributes to nutrient reductions, and therefore less hypoxia. Finally, several of the sampling efforts in 2017 occurred during windy conditions, which may have mixed oxygen deeper into the water column.
In the beginning of June, the National Oceanic and Atmospheric Administration, U.S. Geological Survey, University of Maryland Center for Environmental Science and University of Michigan scientists predicted a slightly larger than average hypoxic volume for the bay due to higher spring flows (January-May) and nitrogen loading from the Susquehanna River.
Monitoring data collection is funded by Maryland, Virginia and the U.S. Environmental Protection Agency’s Chesapeake Bay Program. Hypoxia reports based on monitoring data will resume in June 2018. More information on Maryland’s Chesapeake Bay water quality monitoring program and results can be found on the Eyes on the Bay website.


 1-888-373-7888
 233733