DNR Releases 2015 Midwinter Waterfowl Survey Results
Each winter, aerial survey teams of pilots and biologists from the U.S. Fish and Wildlife Service and the Maryland Department of Natural Resources make visual estimates of ducks, geese and swans along Maryland’s Chesapeake Bay shoreline and Atlantic coast. This year, the teams witnessed more than 855,500 waterfowl, slightly lower than the 905,000 birds observed during 2014, but higher than the five year average of 757,000.
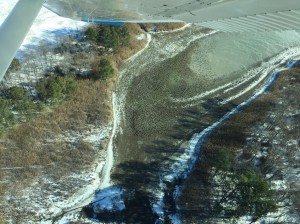
Biologists attribute this year’s count to the fact large areas of the Bay’s tributaries were ice covered during the survey period, concentrating waterfowl where they were more easily counted.
Overall, dabbling ducks were less abundant (90,800) compared to last winter (128,000). Diving duck numbers (192,000) were similar to the numbers observed last winter (190,300). The survey estimate for redhead ducks (32,200) was the highest since the mid-1970s. The canvasback count (64,200) was one of the highest since the mid-1960s, and similar to the January 2014 estimate (68,400). Survey teams also observed large numbers of wintering Canada geese (504,700), mainly along the upper Chesapeake Bay.
“Waterfowl estimates from the survey vary based upon the abundance and distribution of birds, which are influenced by weather, particularly the extent of snow and ice, food availability and other environmental factors,” said Larry Hindman, DNR waterfowl project leader. “For Example, a large concentration of redheads might be seen in Maryland one year and in other years they are generally found just to the south in Virginia or North Carolina.”
The Midwinter Waterfowl Survey has been conducted annually throughout the United States since the early 1950s. The Maryland survey results (see chart below) are ultimately pooled with results from other states to provide a measure of the distributional changes and long-term trends of waterfowl wintering in the Atlantic Flyway.
Keep up to date with DNR’s Wildlife and Heritage Service on Facebook and Twitter @MDDNRWildlife.
Maryland Midwinter Waterfowl Survey Results, 2011 – 2015
Complete survey results (rounded to the nearest hundred)
| Species | 2011 | 2012 | 2013 | 2014 | 2015 |
| Mallard | 55,100 | 57,400 | 33,100 | 75,900 | 50,000 |
| Black Duck | 23,000 | 27,700 | 22,500 | 39,300 | 30,900 |
| Gadwall | 6,400 | 5,000 | 7,400 | 4,000 | 5,100 |
| Wigeon | 200 | 1,400 | 500 | 800 | 2,200 |
| G-W Teal | 600 | 3,700 | 6,300 | 3,900 | 700 |
| Shoveler | 100 | 200 | 1,700 | 100 | 100 |
| Pintail | 1,200 | 1,200 | 1,300 | 4,000 | 1,800 |
| Total Dabblers | 86,600 | 96,600 | 72,800 | 128,000 | 90,800 |
| Redhead | 4,700 | 4,500 | 16,700 | 15,900 | 32,200 |
| Canvasback | 46,100 | 14,300 | 18,400 | 68,400 | 64,200 |
| Scaup | 37,100 | 69,200 | 27,500 | 47,100 | 55,600 |
| Ring-neck | 1,600 | 1,300 | 1,900 | 1,600 | 300 |
| Goldeneye | 300 | 900 | 800 | 1,500 | 600 |
| Bufflehead | 7,800 | 19,800 | 15,600 | 21,800 | 19,100 |
| Ruddy Duck | 17,500 | 15,300 | 17,200 | 34,000 | 20,000 |
| Total Divers | 115,100 | 125,300 | 98,100 | 190,300 | 192,000 |
| Scoters | 200 | 5,100 | 2,000 | 7,600 | 1,300 |
| Long-tailed Duck | 300 | 800 | 600 | 200 | 100 |
| Mergansers | 7,800 | 2,800 | 2,000 | 6,200 | 3000 |
| Total Ducks | 210,000 | 230,600 | 175,500 | 332,400 | 287,200 |
| Brant | 1,500 | 500 | 1,500 | 600 | 900 |
| Snow Goose | 28,200 | 43,400 | 83,300 | 44,200 | 44,900 |
| Canada Goose | 397,700 | 342,600 | 462,000 | 512,100 | 504,700 |
| Tundra Swan | 14,400 | 16,600 | 17,300 | 16,100 | 17,800 |
| Total Waterfowl | 651,800 | 633,700 | 739,600 | 905,500 | 855,500 |

